Using the Web Console
Using the ObserveIT Web Management Console is simple and intuitive. Across the top of the interface are tabs to select a functional view. Each view has a vertical option menu on the left side of the screen. Below the option menu for all views are quick links to the most recent activities.
On the upper left is a mini Admin Dashboard, which is viewable from every page of the Web Console. It provides a quick preview of the Agents' operational statuses and quick access to the full Admin Dashboard.
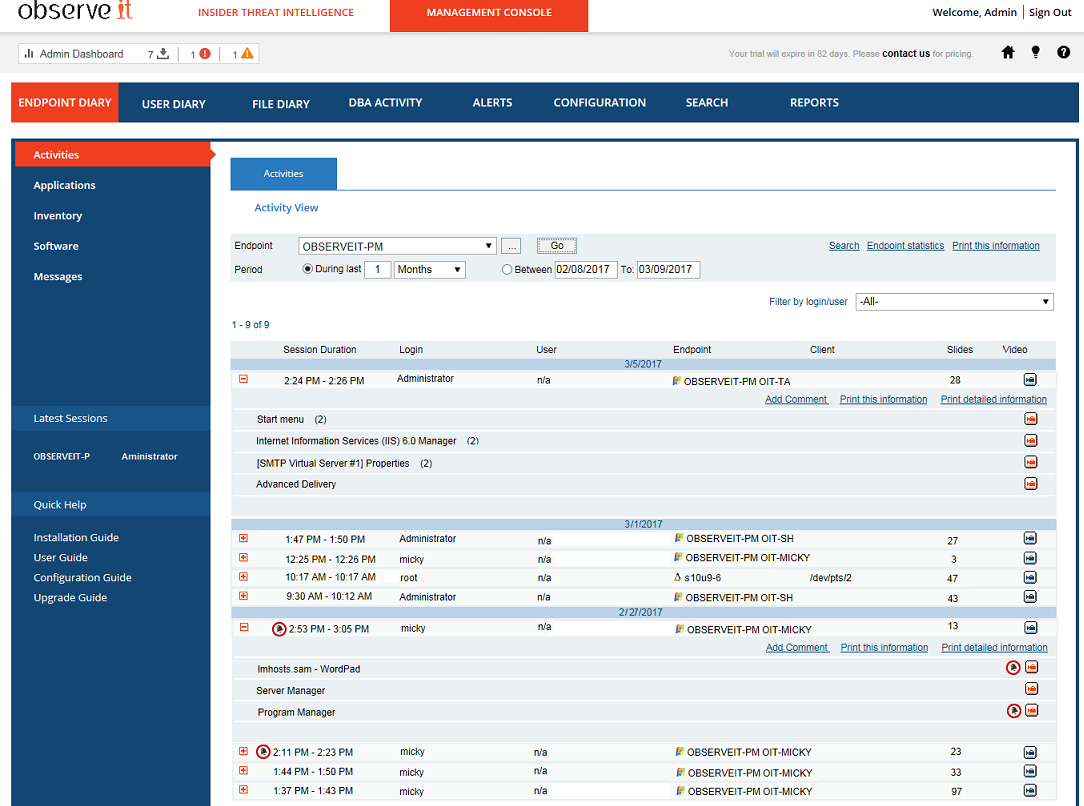
The tabs at the top of the Web Console provide the following functionality:
-
Endpoint Diary: Provides information about all activities that occurred on monitored endpoints.
-
User Diary: Provides information about all user activities that occurred on monitored endpoints.
-
File Diary: Provides information and enables the monitoring of all file activities on monitored endpoints.
-
DBA Activity: Enables monitoring of all SQL queries that were executed by DBAs against production databases.
-
Alerts: Enables ObserveIT users and IT security personnel to view and manage alerts for suspicious or unauthorized user activities that occur during live monitoring of the ObserveIT system.
-
Configuration: From this tab, you can perform all the configuration tasks required by your design criteria and operational needs.
-
Search: Enables you to perform “Google-like” searches for sessions and user activities, based on keywords for various data types, such as, metadata stored in the ITM On-Prem (ObserveIT) Database, ticketing system numbers, applications that were used, and activity alerts according to their ID.
-
Reports: Enables experienced administrators and security auditors to generate reports that provide aggregated or summary information about all monitored Windows and Unix-based server and user activity.