Filtering Events
You can filter the events displayed in the System Events list per specified criteria.
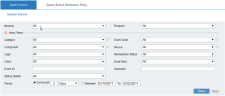
To filter the events displayed in the System Events list
-
From the Severity drop-down list (at the top of the System Events page), select the severity of events that you want to view (the options include: High & Medium, High, Medium, Low). By default, All event severities are displayed.
-
From the Endpoint drop-down list, select the particular endpoint for which you want to view events (or select All to view all endpoints).
-
Expand the More Filters section by clicking
 to filter the events displayed according to additional criteria, as described in the table below.
 -
When you have finished defining your search criteria, click Show to update the event list according to the specified details.
-
To clear the filter fields, click Reset.


More Filters
|
Filter |
Description |
|---|---|
|
Category |
To search for events by category (by the mechanism that generated the event), select an option from the list or select All to view events from all event categories. (The available category depends on the event Source.) Options include:
|
|
Component |
To search for events by the component type on which the events were reported, select an option from the list (Agent, Application Server, Database, File System, Web Console, Rule Engine, Notification Service, Health Monitoring Service), or select All to view all events. |
|
Login |
To search for events by the login name of the user who ran the session in which the event(s) occurred, select an option from the list (or select All). |
|
Client |
To search for events by the client computer from which the user logged in, specify the details (or search for it), or select All to view all events. |
|
Event ID |
To search for a specific event by ID, type the event ID in the text box. |
|
Status Details |
To search for events by status details, select an option from the list (No heartbeat, Service Stopped, Unrecorded Agent Sessions, and so on), or select All to view events according to all status details. For further details, see Assessing Agent Statuses and Details. |
|
Event Code |
To search by event code, select an option from the list, or select All to view all events. |
|
Source |
To search by source (the component that reported the event), select an option from the list (or select All). During the live monitoring of ObserveIT, events can be triggered from the following sources:
|
|
Remediation Status |
To search for events by remediation status, select an option from the list:
|
|
Email Sent |
To search for events for which an email notification was sent or not sent, select Yes or No, or select All to view all events. |
|
Comment |
To search for events by comment, type the relevant text in the text box. |
|
Period |
To specify the time period during which to search for events:
-Or-
|
