Viewing Changes in Alerts and Notifications
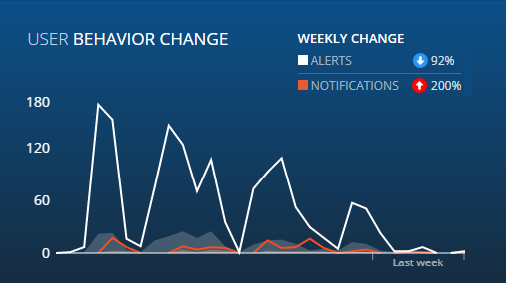
The Weekly Change area displayed next to the User Behavior Change area of the Dashboard shows the change in the number of alerts and out-of-policy notifications in the last week.
If there were no changes in alerts or notifications in the last week, "No change" will be displayed.
The WEEKLY CHANGE area of the Dashboard displays two measurements:
- ALERTS: the percentage change in the number of alerts in the last week.
The percentage change is calculated using the formula: [(B-A)/A] whereby A is the number of alerts on the first day of the week and B is the number of alerts on the last day of the week.
If the value is positive (meaning that the number of alerts went up), an upward arrow icon with a red background is displayed. A negative value indicates that the number of alerts went down, shown by a downward arrow icon with a blue background.
In the above example, the number of alerts went down by 92%.
- NOTIFICATIONS: the percentage change in Out-of-Policy Behavior notifications in the last week.
This is calculated using the same formula as for ALERTS whereby A is the number of notifications seen by the user on the first day and B is the number of notifications seen on the last day of the week.
If the value is positive (meaning that the number of notifications went up), an upward arrow icon with a red background is displayed. A negative value indicates that the number of notifications went down, shown by a downward arrow icon with a blue background.
In the above example, the number of notifications went up by 200%.