Viewing Endpoints
In the Endpoints list, you can view a list of endpoints and related details and the Agents installed on them.
By default, the list displays only endpoints that are currently installed. If you want to view endpoints that were recently uninstalled or unregistered, expand the More Filters section by clicking  and click the Show uninstalled/unregistered endpoints link. For details, see Filtering Endpoints.
To view endpoints and their details
-
Navigate to the Endpoints page (Configuration > Endpoint Management > Endpoints).
You can also access the Endpoints page from the Admin Dashboard, as follows:
- In the Agents portal, by clicking the Agent group name, the error number, or the Tampered With
 or Data Loss
  icons.
-Or-
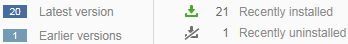
- In the Deployed Agent Versions portal, by clicking the Latest/Earlier version links, or the Recently installed/uninstalled links or icons.

The Endpoints list displays the endpoints, according to the specified endpoint group and filter criteria.
For each endpoint in the list, the following details are displayed:
-
Endpoint Name of the computer.
-
Endpoint IP the Agent uses to communicate with the ITM On-Prem (ObserveIT) Application server. See Viewing Endpoint/Client Names and IP Addresses. Hover the pointer over the IP address and any additional IP addresses are displayed.
-
Recording Policy to which the endpoint is linked (see Linking Endpoints to Recording Policies).
-
Version of the Agent software installed on the endpoint.
-
Status and colored severity bar indicating the event/operational status and severity level (Red (High)=Error, Orange (Medium)=Unreachable/Disabled, Green (Normal/Active)=OK, Blue (Low/Administrative)=Unregistered/Uninstalled). (See also Colored Severity Levels and Icons in the Admin Dashboard section.)
-
Installation date of the Agent software.
-
Last Activity - shows the date of the last user activity (i.e., the last screenshot was received from the Agent). Hovering over this field displays a tooltip that shows the date and time of the last user activity, and the date and time the last Heartbeat signal was sent by the Agent.
- In the Agents portal, by clicking the Agent group name, the error number, or the Tampered With
-
Click
 next to an endpoint in the list to view more details.
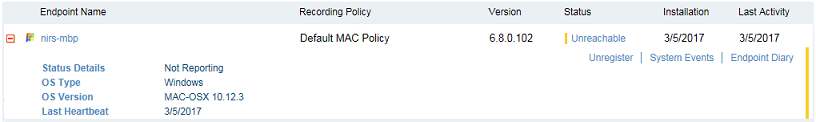
The details vary per the endpoint status. The Status Details field appears only when the status is not "OK". OS Type, OS Version, and Last Heartbeat appear for many statuses.
The following example displays an "Unreachable" status and Status Details displays "Not Reporting". The colored severity bars indicate the event severity level (i.e., Orange=Medium). The Last Heartbeat indicates the time that the last heartbeat signal was sent by the Agent.

-
You can click the System Events link to examine the event(s) that occurred on the endpoint, in order to understand the root cause of the error(s) and any corrective actions you can perform. You can also click the Error link to view the event in the (filtered) System Events list from where you can view expanded details, including Additional Info. For details, see Investigating System Events and Viewing System Events.
-
Clicking the Endpoint Diary link opens the Endpoint Diary page filtered to show all activities that occurred on the selected endpoint.
-
To unregister the endpoint, click the Unregister link. For details, see Unregistering Endpoints.
-
To view an endpoint's properties, click on the endpoint name.