Using the Web Console
Using the ObserveIT Web Management Console is simple and intuitive. Across the top of the interface are tabs to select a functional view. Each view has a vertical option menu on the left side of the screen. Below the option menu for all views are quick links to the most recent activities.
On the upper left is a mini Admin Dashboard, which is viewable from every page of the Web Console. It provides a quick preview of the Agents' operational statuses and quick access to the full Admin Dashboard.
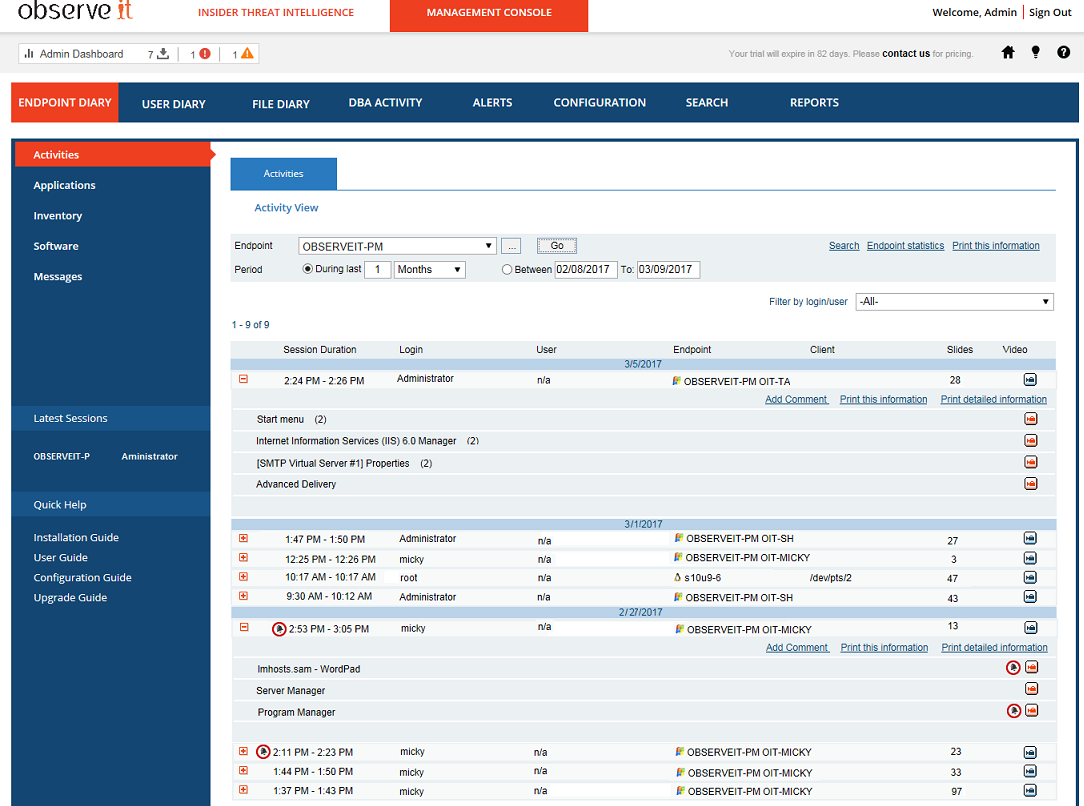
The tabs at the top of the Web Console provide the following functionality:
-
Endpoint Diary: Provides information about all activities that occurred on monitored endpoints.
-
User Diary: Provides information about all user activities that occurred on monitored endpoints.
-
File Diary: Provides information and enables the monitoring of all file activities on monitored endpoints.
-
DBA Activity: Enables monitoring of all SQL queries that were executed by DBAs against production databases.
-
Alerts: Enables ObserveIT users and IT security personnel to view and manage alerts for suspicious or unauthorized user activities that occur during live monitoring of the ObserveIT system.
-
Configuration: From this tab, you can perform all the configuration tasks required by your design criteria and operational needs.
-
Search: Enables you to perform “Google-like” searches for sessions and user activities, based on keywords for various data types, such as, metadata stored in the ObserveIT database, ticketing system numbers, applications that were used, and activity alerts according to their ID.
-
Reports: Enables experienced administrators and security auditors to generate reports that provide aggregated or summary information about all monitored Windows and Unix-based server and user activity.